
Project 1: Titanic Crew Member Survival Data
A project to explore the data of the crew members aboard RMS Titanic and their survival rate.
Abstract
The tragedy of the Titanic disaster has captivated me since I was a young boy. When I was twelve, I used to draw the ship using large pieces of paper taped together. After Titanic was discovered on the ocean floor by Dr. Robert Ballard and his crew in late July of 1985, I collected almost everything I could find on it: (newspaper clippings, magazines, books, etc.) And yes, I absolutely loved the movie “Titanic” by James Cameron, not necessarily for the story line of Jack and Rose, but because of the way Cameron painstaking re-created what the ship looked like — it was simply stunning to see something that I had imagined and only seen black and white photos of on full display in full color and vivid and intricate detail! The next great bit for me as a Titanic history buff was taking my family to see artifacts from the ship on display when an exhibit came to Omaha. While I will not delve into the ethics or legality of plucking items from a shipping disaster from the ocean floor, or share my thoughts on who actually owns the items and their rights to salvage them, I will say that seeing those personal items and especially a large chunk of steel from the ship — including port holes — was very moving.
It is with this background that I chose to continue the exploration of Titanic survivor data, by doing analysis on not the passengers that survived the disaster, but the actual crew members employed by White Star Line who survived.
Data Sources
There is a wide and vast amount of information on the Titanic available, most of it public and freely available to consume via books, newspapers, magazines, and of course, the Internet. The sinking of this ship on the evening of April 14-15, 1912 was one the largest tragedies of its day, and additionally, it was — at the time — the largest loss of life in maritime history. There were over 1,500 souls who perished on the sinking of Titanic, including men, women, children from all classes and walks of life; however, for this project, I am keying in on those who worked aboard the ship. For information specifically on Titanic’s crew, I went to what I consider a pretty reliable resource, the Titanic People Database as created by Encyclopedia Titanica. More information can be found here:
https://www.encyclopedia-titanica.org.
The site has an online and downloadable listing of records of passengers and crew, survivors, etc. I’m a bit of a Titanic junkie, so I already had a subscription to this site which allows for more granular downloading of data in various formats. Another source of data is a rather well-known set from Kaggle and it is free to download from https://www.kaggle.com/c/titanic/data.
Data Input
After downloading and looking through the dataset from Encyclopedia Titanica, it was determined that I would not require any additional data from the Kaggle dataset, as I already had everything I looking for. Here’s a look at the initial steps of data input and verification:
import pandas as pd
import yellowbrick

# Load crew data into a dataframe
list = "titanic_crew_original.csv"
crew = pd.read_csv(list)

# Check the dimension of the table:
print("The dimension of the table is: ", crew.shape)

# Check the results:
print(crew.head(5))
It looks like there are 1,126 rows (crew members), and 16 columns (variables).
Data Cleanup: Overview
In the data science realm, a lot of the work done is very similar to any other field or line of work — preparation is key. Just as you shouldn’t paint a wall, stain a dresser, or lay out a walkway made of brick pavers as the first line of action, you must do the less glamorous but hard work that is required before getting to those “fun” steps. You need to fill any holes in that wall, and perhaps give it a coat of primer. That dresser needs the old stain removed first and/or sanded down, and that walkway is not going to be safe unless you level and pack the ground and fill it with crushed stone to build a solid foundation to set the pavers on. This “grunt” work is the foundation for what comes next. As it is in data science. Ensure the data is rock solid first, and they you get to enjoy the fruits of your labor with the data exploration and visualization!
The default data file containing all of the crew data for Titanic’s maiden voyage as downloaded from https://www.encyclopedia-titanica.org was a tremendous resource for this analysis, and it included a total of sixteen columns of data. After taking an initial look at the data after input, I then began the data analysis, starting with data cleanup. I established the cleanup process with the following four steps:
- Verify there is no missing data and that the data there is accurate
- Remove unnecessary data
- Fix any data formatting issues (if any)
- Identify and remove any duplicate entries
Data Cleanup: Verify Data
This step was primarily accomplished upon loading the data and looking at all of the column headings and information in the rows. Once I could trust the information downloaded contained the things I wanted, I then created different one-off datasets based upon the category in the Class/Dept column and also the Occupation column to verify that the total number of crew members that worked in these various departments and parts of the ship were as expected when comparing to other resources that listed this type of information. This is where the verification step proved it’s worth. [6] According to multiple references, there were 891 crew members aboard Titanic bound for New York, but according to the imported dataset, there are 1,126 rows (crew members).
Why the discrepancy? In attempt to understand the difference, I noticed that some rows had no entry under the Deceased column which didn’t make sense at first, and then I realized… those crew members were ones that didn’t actually make the trans-Atlantic voyage. When Titanic departed Southampton, England at noon on April 10th, 1912, bound for New York, it made a few stops along the way, one in Cherbourgh, France that same evening, and then again later that same night in Queenstown, Ireland. The ship actually stayed docked in Queenstown that night and didn’t leave again until the next day, April 11th at around 1:30pm. These stops were made for three primary reasons: to take on more passengers, to get and load more supplies onto the ship, and to move mail. Steamships of that era required a lot of coal to burn to power the engines, turbines, and propellors to move the ship through the water, and also to generate electricity to light the ship. How much is a lot? Titanic’s massive boilers required 825 tons of coal per day.[4] The moving mail portion might come as a surprise to some. What does Titanic have to do with mail? The RMS of RMS Titanic stands for Royal Mail Steamer, a designation that the ship was used as a traveling post office and mail transportation device for not only passengers and crew who could send postcards, mail, and packages along their journey, but also under contract to the British Royal Mail.[1] As luck would have it, for 236 souls employed by White Star Line, their call of duty had them departing Titanic at one of these two stops in Cherbourgh or Queenstown before it left on the tragic, fateful trip to New York City. Actually, that number is more accurate at 228. Wait, what? Why another discrepancy and what about those other eight crew members? Well, it seems that just like in any other job, working for White Star Line had some folks that just weren’t cut out for it for the long haul. That’s right — eight people that had worked for the company and were assigned to the maiden voyage of Titanic ultimately made the smartest decision of their life and quit (in seafaring terms, it is referred to as deserting their post) before the ship left for New York City. In researching this information with more depth, every deserter was a male assigned to the Engineering crew, and seven of the men held the title of “Fireman”, and one was a “Trimmer”. [4] Both of these roles were some of the most labor intense, and involved the dirty, extremely grueling work of working with coal on a coal-fired, steam-powered ship — either loading, moving, and transporting it, as was a Trimmer’s duty, or by shoveling it into the boilers, which was a Firemen’s role.
After all of this research, and thereby realizing how the 236 crew member number difference came to be, I proceeded to the next step — getting rid of unnecessary data.
Data Cleanup: Remove Unnecessary Data
As the default downloaded list, the crew members of Titanic’s maiden voyage contained a total of 1,126 rows, each representing a life aboard the ship working hard to make the trip safe, successful, and enjoyable for the passengers. As discussed in the previous section, this data isn’t going to be accurate for the analysis of who survived or not, since 236 crew members actually departed Titanic before it took off for New York. While the downloaded dataset featured the expected data with column headers such as Name, Gender, Class/Dept, and Occupation, there were also numerous columns that would not be beneficial nor required for this analysis. The columns that I removed from the dataset include Born, Died, Boat, Body, and URL. Additionally, there are three columns with empty data that won’t be used: Ticket, Fare, and Cabin. Once I had things pared down, this is what the dataset looked like after getting rid of unneeded data:
# Remove rows that don't contain survival data:
crew = crew[crew.Survived.notnull()]

# Remove the columns from the df we aren't using:
del crew['Born']
del crew['Died']
del crew['Boat']
del crew['Body']
del crew['URL']
del crew['Ticket']
del crew['Fare']
del crew['Cabin']

# Check the dimension of the table:
print("The dimension of the table is: ", crew.shape)

# Check the results:
print(crew.head(5))
By cleaning the data to remove all unneeded information, we get a dataframe with 891 rows and 8 columns (variables), which will aid in trying to find any clues to the research questions. But before we start asking those research questions, let’s get a closer look into what our dataset now contains:
# What type of variables are in the table:
print("Describe Data")
print(crew.describe())
print("Summarized Data")
print(crew.describe(include=['O']))
To help understand the meaning of the column headers (the variables), I created the following table:
| Variable | Definition | Key |
|---|---|---|
| Name | Name of crew member | |
| Age | Age of crew member in years | |
| Gender | Gender | |
| Class/Dept | Department of the ship worked in | |
| Joined | The stop (city) at which the crew member boarded Titanic | |
| Occupation | More detail about the specific role of the crew member | |
| Survived | Survival status | 0 = No; 1 = Yes |
| Nationality | Country the crew member was from |
Data Cleanup: Fix Data Formatting Issues
After verifying and removing all unnecessary Titanic crew member data, the next stage of my cleanup process entailed ensuring that all of the data was formatted correctly. From this standpoint, everything checked out and I did not need to take any corrective action here.
Data Cleanup: Remove Duplicate Entries
After completing the three previous steps, it was time to do the last portion of my cleanup process — looking for and removing any duplicate entries. Let’s look at the code to do that:
# Find and remove any duplicate entries
crew_duplicates = crew.duplicated()
print('Number of duplicate entries found: {}'.format(crew_duplicates.sum()))
It looks like everything checks out, and that we have no duplicates; however, just to be sure, I want to run another test:
# Ensuring that the test for duplicates is accurate:
duplicate_test = crew.duplicated('Survived').head()
print('Number of entries with duplicate Survived status in top entries are {}'.format(duplicate_test.sum()))
crew.head()
Okay, I have verified that when I run a duplicates check on the data using the information in the Survived column, I show there are duplicates. It never hurts to double-check!
Research Questions
Now that I have completely ran through the data cleanup process and I am comfortable and confident in the data being accurate, error-free, being exactly what I need, and that there are no duplicates, it is time to begin looking into the ways that I can answer the research questions I had in mind when I chose to take on this project.
The sinking of Titanic was certainly a tragedy and I specifically want to know about the outcome of Titanic’s crew. Here are my research questions:
- What was the survival rate for Titanic crew members?
- What was the survival rate of the crew members compared to the passengers on the ship?
- How many of the crew members were men and how many were women and did that impact their survival status?
- In which parts of the ship did the crew members work and did that have any impact on their survival?
- At which port did the crew members board the ship and did that have any impact on their survival status?
I will be using Python and R to do the data analysis an attempt to find answers to these questions.
Data Exploration and Analysis and Data Visualization
It is now time to start digging into the data questions I had about the crew members of Titanic, and I will use this section by framing out the questions I had and begin the exploration and analysis of the data to answer those questions using R and Python. In particular I will generate visualizations that will look to provide a much more detailed view into the crew data. One of the first questions I had regarding the crew members of Titanic is what was their survival rate?
The story is well known that during the sinking of Titanic, more than 1,500 people — 1,517 to be exact — lost their lives. [3] The really unfortunate part of this tragedy is that it shouldn’t have happened — for numerous reasons — most especially that the ship didn’t have enough lifeboats for all on board. Titanic was equipped to carry 64 lifeboats; however, the ship only actually set sail with 20 — and four of those were collapsible, a smaller, more easily storable type of boat. The total number of souls that the lifeboats could carry was 1,178 passengers and crew, but that number was still more than required by the 1883 Merchant Shipping Act. Still, just over 700 made it aboard lifeboats. In 1912, the tradition for loading lifeboats during an emergency was women and children first, and unfortunately, this tradition often caused time delays in filling the lifeboats as the women and children were singled out for priority in lifeboat placement, which often led to lifeboats being launched only half full, if that, amidst the chaos of a sinking ship. This was certainly the case with Titanic on that cold, April night with freezing temperatures on the Atlantic Ocean. [11]
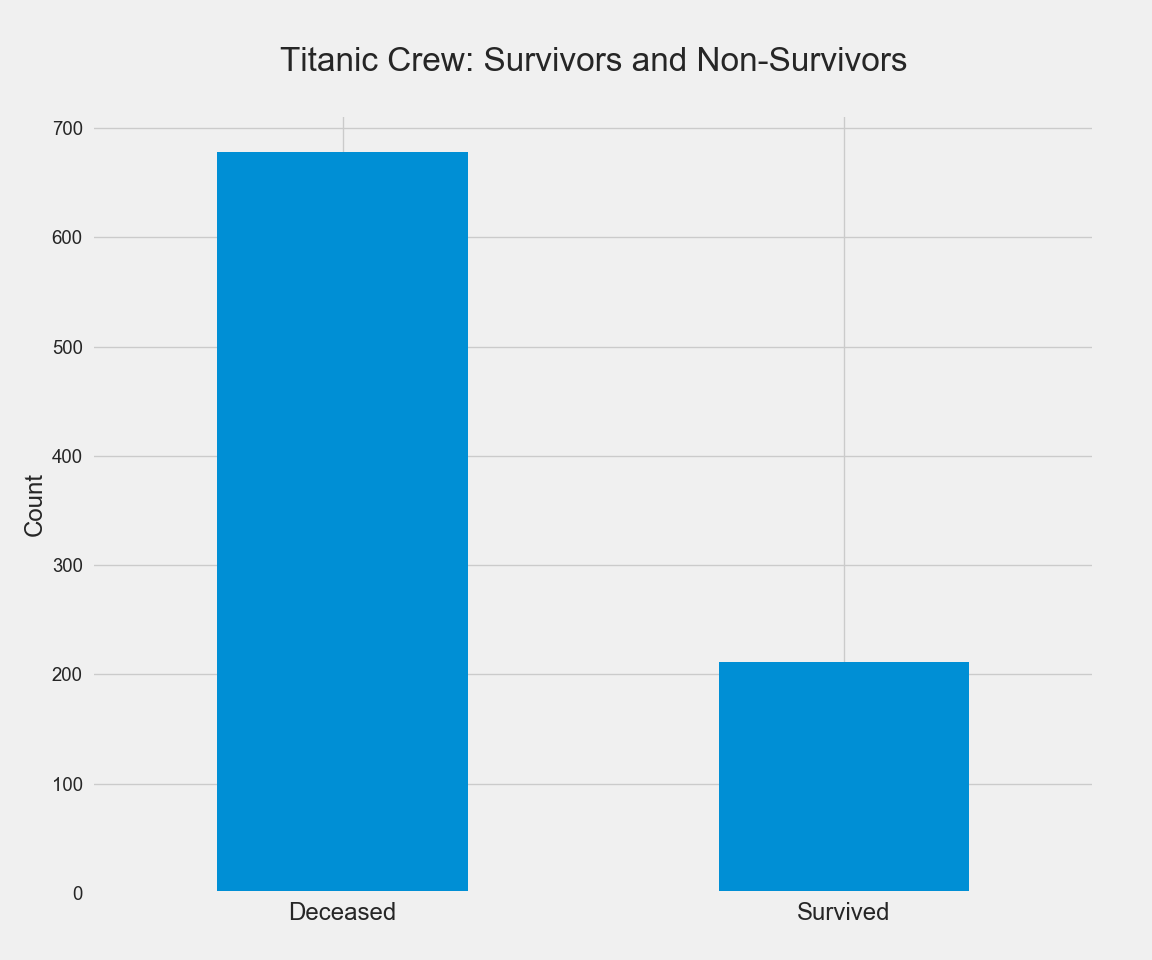
It’s now time to tell the data story of Titanic’s crew members. In total, there were 1,517 souls lost during this tragedy. From the total of 891 crew members, 679 did not survive, a survival rate of around 24%. From the ship’s passenger perspective, there were a total of 1,352 passengers aboard and 500 survived, a survival rate of 40%. The data tells us that the Titanic crew members had less of a chance of survival than the passengers did.
Let’s take a closer look at our Titanic crew survival data using a bar chart:
# Load the cleaned crew data:
list_cleaned = "titanic_crew.csv"
crew = pd.read_csv(list_cleaned)

# Import visulization packages:
import matplotlib.pyplot as plt

# Set up the figure size and color parameters:
plt.rcParams['figure.figsize'] = (20, 20)
plt.style.use('fivethirtyeight')

# Set charting parameters:
plt.style.use('fivethirtyeight')

# Suvrived and Deceased:
x_ticks_labels = ['Deceased','Survived']
ax = crew.groupby('Survived')['Name'].nunique().plot(kind='bar', fontsize=14, figsize=(12,10))
ax.set_xticklabels(x_ticks_labels, rotation='horizontal', fontsize=18)
ax.set_title('Titanic Crew: Survivors and Non-Survivors\n', fontsize=25)
ax.set_ylabel('Count', fontsize=18)
ax.set_xlabel('')
plt.show()
To answer the research question of how many of the crew members were men and how many were women, let’s again turn to a bar chart:
# Set charting parameters:
plt.style.use('fivethirtyeight')

# Gender:
x_ticks_labels = ['Female','Male']
ax = crew.groupby('Gender')['Name'].nunique().plot(kind='bar', fontsize=14, figsize=(12,10))
ax.set_xticklabels(x_ticks_labels, rotation='horizontal', fontsize=18)
ax.set_title('Titanic Crew: Gender\n', fontsize=25)
ax.set_ylabel('Crew Members', fontsize=18)
ax.set_xlabel('')
plt.show()
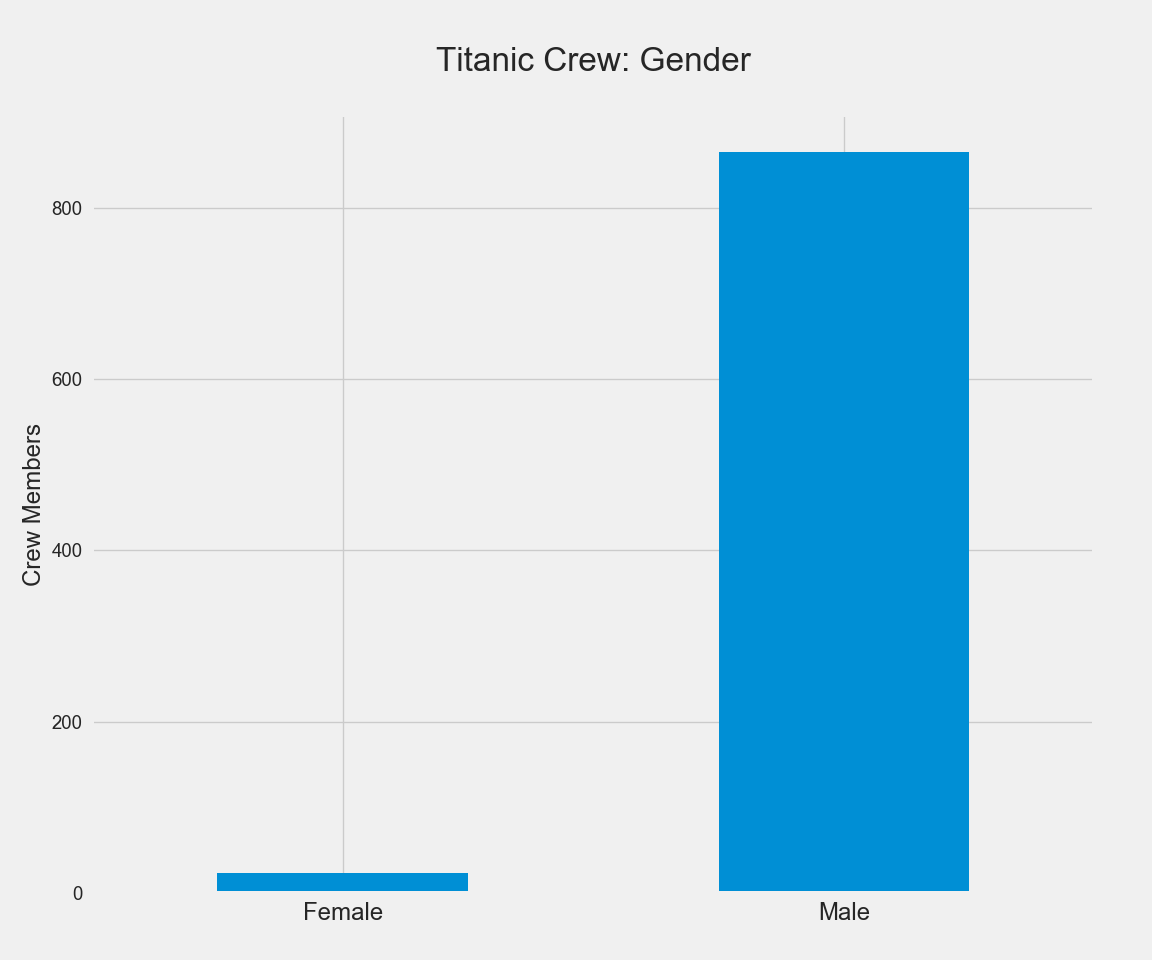
Looking at the data, the number of male crew members aboard the Titanic’s maiden voyage far outnumbered the women. In fact, of the 891 crew members, only 23 were women. Why such a large discrepancy? For that we should look more into the different departments that worked aboard the ship. Here’s that data:
# Class/Dept:
x_ticks_labels = ['Deck','Deck Officers', 'Engineering', 'Postal Clerk', 'Restaurant', 'Victualling']
ax = crew.groupby('Class/Dept')['Name'].nunique().plot(kind='bar', fontsize=14, figsize=(12,10))
ax.set_xticklabels(x_ticks_labels, rotation='horizontal', fontsize=18)
ax.set_title('Titanic Crew: Departments\n', fontsize=25)
ax.set_ylabel('Crew Members', fontsize=18)
ax.set_xlabel('')
plt.show()
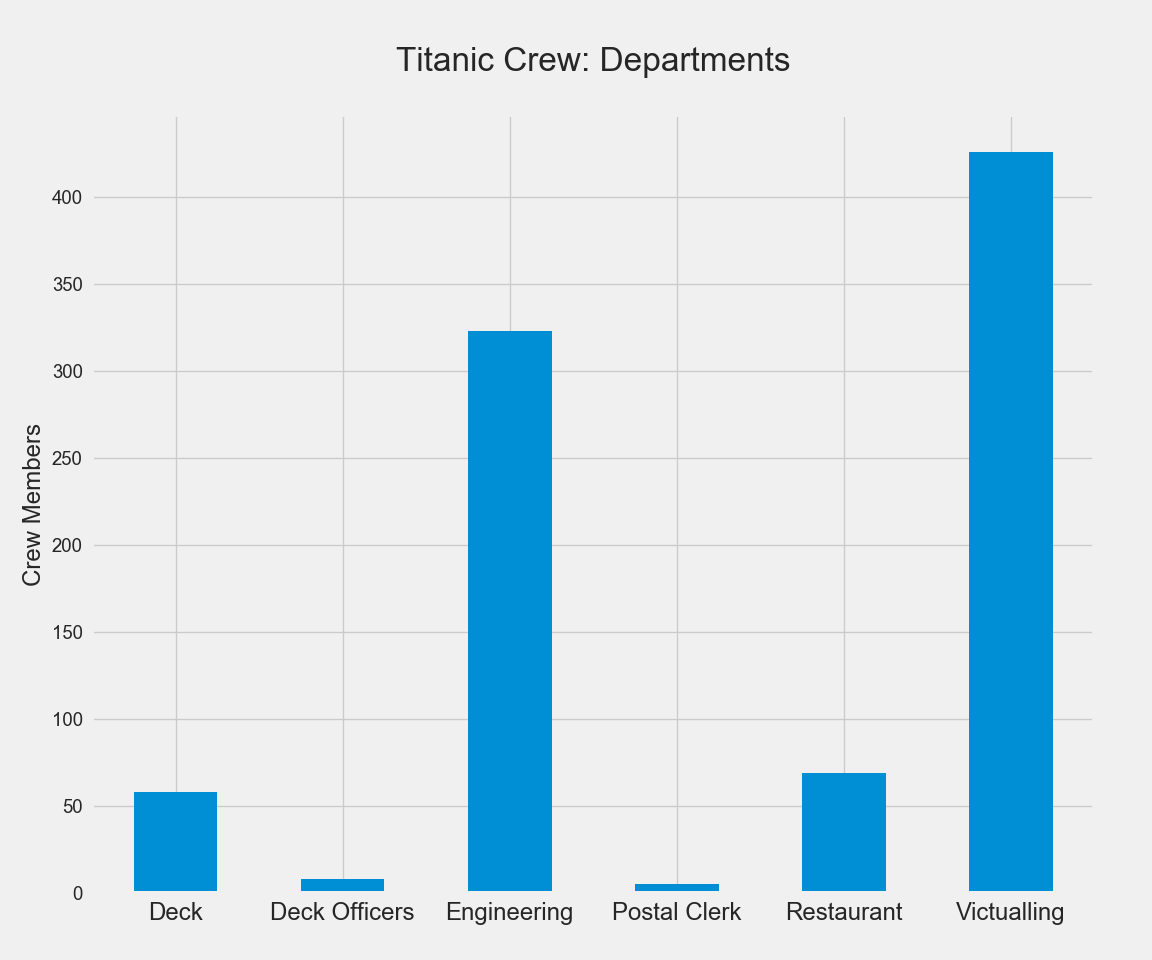
This information shows that most of the crew members of Titanic were in the victualling department; this is the department that provides all the services for the occupants of the ship: food, housekeeping, laundry, room service, etc.
The next highest amount of crew members aboard Titanic were engineers. The engineers were responsible for keeping the engines, generators, and other mechanical equipment on the ship running. They were also the highest paid members of the crew (not counting the officers) and had the education and technical expertise to operate, maintain, and repair the engineering plant.
Survivor Data
Now let’s look at some of the same data showing just survivors of the sinking. First we’ll create the new dataframe of just the survivors:
# Create a new dataframe of just survivors:
survivors = crew.loc[crew['Survived'] == 1]

# Check the dimension of the table:
print("The dimension of the table is: ", survivors.shape)

# Get a look at the first five rows of the survivor df:
print(survivors.head(5))
Per the chart in our initial look at all of the crew member data, our new survivors dataframe verifies that only 212 out of the 891 crew members of Titanic survived the sinking. Now that the data is isolated to show just survivors, let’s look at some of the same bar charts as before showing survivor-related data only:
# Class/Dept:
x_ticks_labels = ['Deck','Deck Officers', 'Engineering', 'Restaurant', 'Victualling']
ax = survivors.groupby('Class/Dept')['Name'].nunique().plot(kind='bar', fontsize=14, figsize=(12,10))
ax.set_xticklabels(x_ticks_labels, rotation='horizontal', fontsize=18)
ax.set_title('Titanic Crew Survivors: Departments\n', fontsize=25)
ax.set_ylabel('Crew Members', fontsize=18)
ax.set_xlabel('')
plt.show()
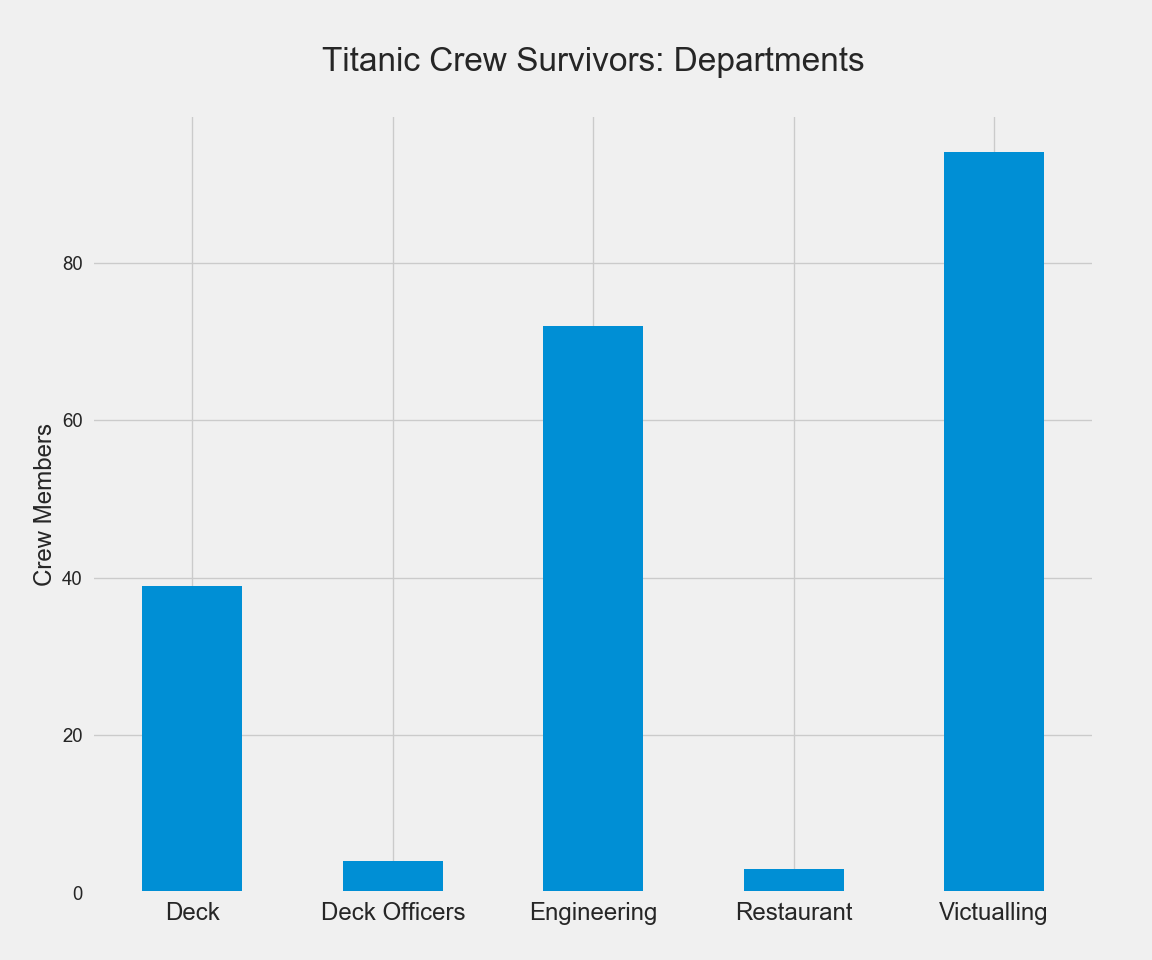
This chart looks a bit different that the listing of all crew members. You can see that all five of the postal clerks aboard the ship did not survive, and that while a good majority of the deck crew did, many of the members of the engineering and victualling departments did not.
One final chart, this showing the crew survivors by gender:
# Gender:
x_ticks_labels = ['Female','Male']
ax = survivors.groupby('Gender')['Name'].nunique().plot(kind='bar', fontsize=14, figsize=(12,10))
ax.set_xticklabels(x_ticks_labels, rotation='horizontal', fontsize=18)
ax.set_title('Titanic Crew Survivors: Gender\n', fontsize=25)
ax.set_ylabel('Crew Members', fontsize=18)
ax.set_xlabel('')
plt.show()
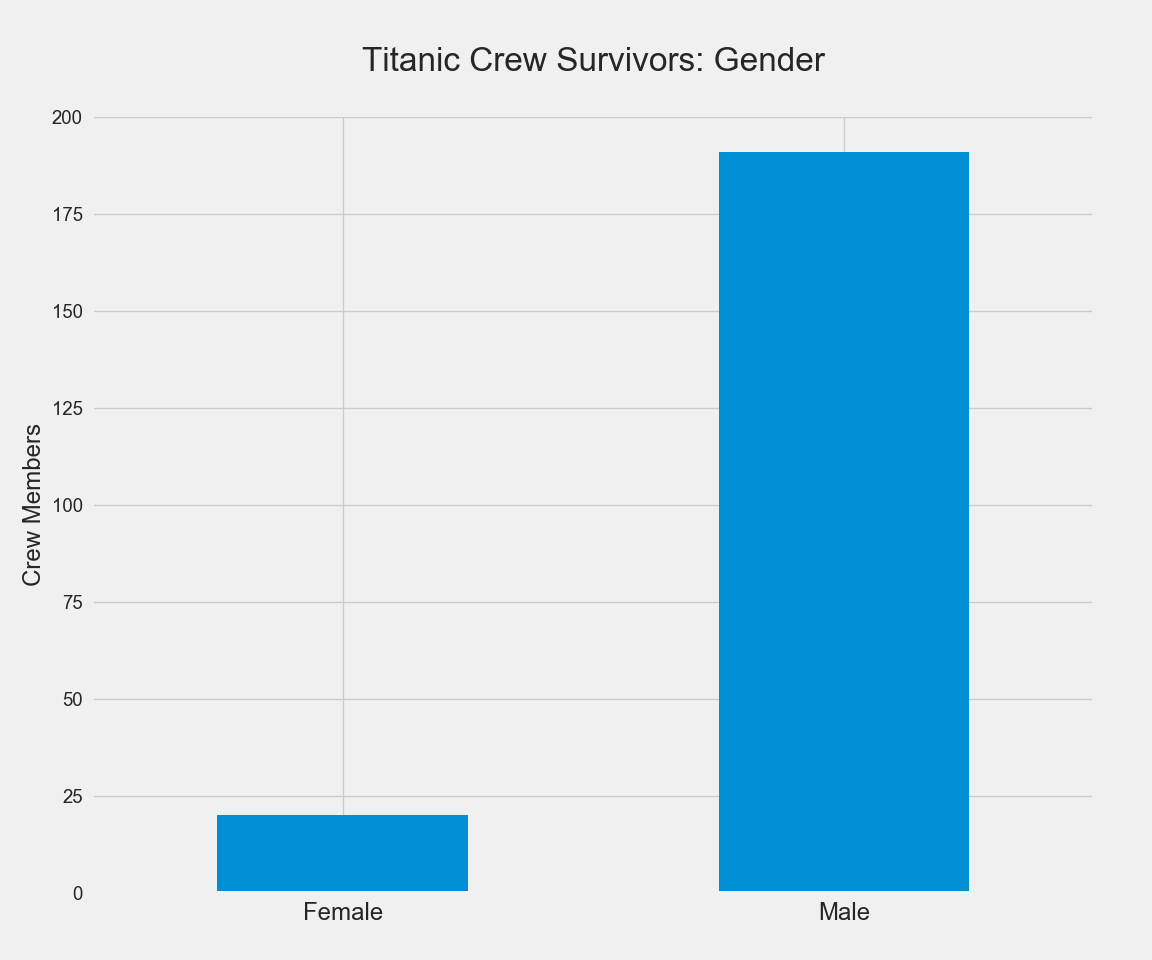
Of the 23 crew members aboard Titanic that were women, 20 of them survived the disaster, right around 87%, whereas of the 868 men, 192 of them survived, a rate of 22%.
Conclusion
There were many people that died when RMS Titanic sank on its maiden voyage in April 1912, including those who were crew members, employed by the White Star Line to service the passengers on the ship. After exploring data on the crew members to look for any trends in the data from those that survived the disaster, some items stood out.
Recall there were five research questions that I wanted to answer when looking through this data:
- What was the survival rate for Titanic crew members?
- What was the survival rate of the crew members compared to the passengers on the ship?
- How many of the crew members were men and how many were women and did that impact their survival status?
- In which parts of the ship did the crew members work and did that have any impact on their survival?
- At which port did the crew members board the ship and did that have any impact on their survival status?
While there was not much correlation to the port (city) in which the crew members boarded Titanic, I was able to glean information on the other questions, notably that crew members’ survival rate (24%) was less than that of the passengers (40%). Additionally, there were only 23 women crew members out of the 891 total, and 20 of them survived, an 87% survival rate. The last research question regarding crew department and survival rate shows that those with less seniority and status as far as department goes were most likely to perish in the disaster. [7] A fair amount of the ship’s deck crew survived, most likely because they were put in charge of manning the lifeboats, and also assigned to them as rowers as they were lowered to the ocean during the calamity. Unfortunately, the majority of the workers who were in lower parts of the ship — especially right above the hull (bottom) where the boilers were located [10] did not survive. All five of the postal clerks aboard the ship perished, most likely due to the mailroom being one of the first rooms impacted by the iceberg strike and first to become flooded with freezing sea water. [8]
References and Annotations:
- Harrell, Frank E. (2002, December 27). “Titanic Data” from http://biostat.mc.vanderbilt.edu/wiki/pub/Main/DataSets/titanic.html
- Zuckerman, Arthur. (2020, May 24). “57 Titanic Statistics: Deaths, Passengers & Survivors” from https://comparecamp.com/titanic-statistics/
- Encyclopedia Titanica. (2020). “Titanic Crew Survivors” from https://www.encyclopedia-titanica.org/titanic-crew-survivors/
- Ultimate Titanic. (2012, April). “Titanic: By the Numbers” from https://www.ultimatetitanic.com/facts-statistics/
- Encyclopedia Britannica. (2020). “Titanic” from https://www.britannica.com/ topic/Titanic
- Titanic Database. (2012, April). “List of crew members on board RMS Titanic” from https://titanicdatabase.fandom.com/wiki/Crew_of_the_RMS_Titanic
- History on the Net. (2020). “The Titanic — Crew” from https://www.historyonthenet.com/the-titanic-crew
- Lehnhardt, Karin. (2019, July 3). “45 Unsinkable Titanic Facts” from https://www.factretriever.com/titanic-facts
- RMS Titanic - Ship of Dreams. (2014). “Designing & Building Titanic” from http://www.titanicandco.com/construction.html
- History. (2020, October 30). “Titanic by the Numbers: From Construction to Disaster to Discovery” from https://www.history.com/news/titanic-facts- construction-passengers-sinking-discovery
Project Proposal
Which Domain?
What domain is this data going to come from? Please list 10 references (with a brief annotation) to use to make sense of what you’re doing with these data.
The sinking of the Titanic is a heart-breaking tale, and while much of the tragedy focuses on the passengers of the ship, I feel the workers have a story that goes untold. My first project will be an analysis of the crew members employed by the White Star Line that were aboard the fateful voyage.
Which Data?
What is the dataset you’ll be examining? Please provide a codebook if there is one or a link to the dataset as well as a detailed description.
For information specifically on Titanic’s crew, I will be using data from the Titanic People Database as created by Encyclopedia Titanica. More information can be found at https://www.encyclopedia-titanica.org. The site has an online and downloadable listing of records of passengers and crew, survivors, etc. I’m a bit of a Titanic junkie, so I already had a subscription to this site which allows for more granular downloading of data in csv format. Another source of data is Kaggle: https://www.kaggle.com/c/titanic/data. 2
These are a few of the variables that I will be exploring:
| Variable | Definition | Key |
|---|---|---|
| PassengerId | Passenger ID | |
| Survived | Survival | 0 = No; 1 = Yes |
| Pclass | Ticket class | 1 = 1st, 2 = 2nd, 3 = 3rd |
| Name | Name of passenger | |
| Sex | Sex | |
| Age | Age in years | |
| SibSp | # of siblings / spouses aboard the Titanic | |
| Parch | # of parents / children aboard the Titanic | |
| Ticket | Ticket number | |
| Fare | Passenger fare | |
| Cabin | Cabin Number | |
| Embarked | Port of Embarkation | C = Cherbourg, Q = Queenstown, S = Southampton |
Research Questions? Benefits? Why Analyze these Data?
How are you proposing to analyze this dataset? This is about your approach. Here, you’ll be proposing your research questions as well as justifications for why you’d offer these data in this way.
I specifically want to know about the survival rate of Titanic’s crew. How many total crew members were there and how many survived? How many were men and how many were women? In which parts of the ship did they work? At which port did they board the ship? I will be using Python and/or R to do the data analysis an attempt to find answers to these questions.
What Method?
What methods will you be using? What will those methods provide in terms of analysis? How is this useful?
The methods I will use for the analysis of the crew survivors will most likely include bar charts, ROC curve, and logistic regression. These will provide clarity on crew members, who survived, and if there are any trends or patterns in the data as to why they survived while others did not.
Potential Issues?
What challenges do you anticipate having? What could cause this project to go off schedule?
I am worried about not having enough information to draw any conclusions that I will be able to state definitively whether there are any actual predictors to which crew members would have survived the sinking.
Concluding Remarks
There were many people that died when RMS Titanic sank on its maiden voyage in April 1912, including those who were crew members, employed by the White Star Line to service the passengers on the ship. I am exploring data on the crew members to look for any trends in the data from those that survived the disaster.
Project Check-In
Any surprises from your domain from these data?
The sinking of the Titanic is a heart-breaking tale, and while much of the tragedy focuses on the passengers of the ship, I feel the workers have a story that goes untold. My first project is an analysis of the crew members employed by the White Star Line that were aboard the fateful voyage. So far, there isn’t anything too surprising with the data; however, it was a bit jarring to see how far many more men were members of the crew than women. But after looking over the data and seeing it from the perspective of the different departments, it began to make sense as there were many more men that were parts of the crew to shovel coal into the boilers to provide power and electricity to the steam-powered ship.
Is the dataset what you thought it was?
Going into it, I was pretty confident that that dataset from the Titanic People Database as created by Encyclopedia Titanica — https://www.encyclopedia-titanica.org — was going to be what I expected, and it turned out that it was. As I’m a bit of a Titanic diehard, I already had a subscription to this site which allows for more granular downloading of data in csv format and I was able to view online and download a listing of records of all crew data including survival data. I also retrieved data from Kaggle: https://www.kaggle.com/c/titanic/data as a way to do cross-referencing and build out a more complete dataset if/as needed.
Have you had to adjust your approach or research questions?
We are a few weeks in, and so far I have not yet had to adjust my approach or research questions. With the data that I have, I can see how many total crew members there were on the ship, and how many of them survived. I have a dataset showing how many crew members were men and how many were women, and I can also see the different departments of the ship they worked in — for example, engineering, hospitality, etc. Another interesting data point is the port (city) in which they boarded Titanic and began their working journey on the trip to New York.
Is your method working?
As I make my way through the data and look to get answers to my questions, the methods for analyzing Titanic crew survivor data appear to be working. I have gotten a good look at some of the information using bar charts, a nice and simple way to see the answers to my questions. Another part of the process has been converting categorical data for the port city information to numerical data and that has gone smoothly as well. Time will tell if the ideas that I have here will completely pan out but I believe that they will based upon what I am seeing so far.
What challenges are you having?
Regarding challenges, I am still working through the best way to present the data. I am comfortable displaying this information using a combination of bar charts and other methods, but am wondering if there is something else that would work as effectively or better. I am contemplating the idea of creating something more visually appealing such as a nice infographic and using multiple graphics to help better tell the data story of the crew and where they worked on the ship, such as their physical location and deck level on the ship. As I work more through the data, I am sure that the best answer will present itself.
Questions and Answers
Why did you choose this as a project subject?
I’ve been interested in the story of Titanic since I was around ten years old, and especially after it was discovered by Robert Ballard and crew in the summer of 1985.
Did anything during this project surprise you? In what way?
I was a bit surprised at how much less of a chance of survival the 891 crew members of the ship had. I certainly understand doing your job well and being of service, but for some reason I expected the survival rate of the crew to be closer to that of the passengers. Less than 1 in 4 of the crew survived while 4 out of ten passengers did.
Is there anything that you would have done differently?
I was hoping to do a stunning visual of the ship and represent the survival data in that fashion, but as of yet I have not gotten that accomplished.
Did you get all of the answers to your research questions?
Surprisingly, yes I did get all of the answers to the questions I had asked upon starting this project.
What would you have liked to have gone better?
I wish that there was more time to get the project done. These are pretty tight deadlines, but that’s okay.
What did you think of James Cameron’s movie, Titanic?
It’s amazing. The replication of the ship and all of the detail was absolutely stunning.
What good (if any) came as a result of this disaster?
It’s hard to quantify any good when over 1,500 people lost their lives. But one thing that did happen after the Titanic disaster was that it became a requirement for all ships to carry enough lifeboats for all passengers and crew.
Are there any other research questions you would like to try to find answers for?
Not necessarily research questions, but one thing I would like to know more about are the eight people that deserted their post for their duty on Titanic. That would make a wonderful movie. What happened to them afterwards? Did they have success? Did they feel any guilt for having lived (for what it’s worth, I don’t think they should).
Do you have any Titanic artifacts?
No, but I have seen bits of coal salvaged from the wreck site for sale from the company that owns the salvage rights of Titanic’s resting site and I wouldn’t feel guilty about owning that.
How do you feel about salvaging artifacts from Titanic?
I am torn. On one hand I would love to see parts and artifacts of what is left of the ship in a museum, yet, it is truly a gravesite. Perhaps the best answer is articulate photography and videography and that can be good enough.