

Using R and Python to Improve a Marketing Promotion
An exercise using R and Python to improve a marketing promotion in Major League Baseball.
Introduction
This is an exploration of improving the attendance of a Major League Baseball game by using data science. Using Major League Baseball fan attendance data from 2012, R and Python will be used to determine what night would be the best to run a marketing promotion to increase attendance.
Import Data
Let’s import the data, shall we?
# Load the readr package:
library(readr)

# Read the baseball data in from the csv file:
baseball <- read.csv("dodgers.csv", stringsAsFactors = FALSE)
Summarize
Now let’s take a quick look using the summary and str commands to make sure our import worked as expected and we’re seeing the data we expect:
# Show a summary to get an understanding of the results:

summary(baseball)
##     month                day            attend      day_of_week
##  Length:81          Min.   : 1.00   Min.   :24312   Length:81
##  Class :character   1st Qu.: 8.00   1st Qu.:34493   Class :character
##  Mode  :character   Median :15.00   Median :40284   Mode  :character
##                     Mean   :16.14   Mean   :41040
##                     3rd Qu.:25.00   3rd Qu.:46588
##                     Max.   :31.00   Max.   :56000
##    opponent              temp          skies            day_night
##  Length:81          Min.   :54.00   Length:81          Length:81
##  Class :character   1st Qu.:67.00   Class :character   Class :character
##  Mode  :character   Median :73.00   Mode  :character   Mode  :character
##                     Mean   :73.15
##                     3rd Qu.:79.00
##                     Max.   :95.00
##      cap               shirt            fireworks          bobblehead
##  Length:81          Length:81          Length:81          Length:81
##  Class :character   Class :character   Class :character   Class :character
##  Mode  :character   Mode  :character   Mode  :character   Mode  :character
##
##
##
str(baseball)
## 'data.frame':    81 obs. of  12 variables:
##  $ month      : chr  "APR" "APR" "APR" "APR" ...
##  $ day        : int  10 11 12 13 14 15 23 24 25 27 ...
##  $ attend     : int  56000 29729 28328 31601 46549 38359 26376 44014 26345 44807 ...
##  $ day_of_week: chr  "Tuesday" "Wednesday" "Thursday" "Friday" ...
##  $ opponent   : chr  "Pirates" "Pirates" "Pirates" "Padres" ...
##  $ temp       : int  67 58 57 54 57 65 60 63 64 66 ...
##  $ skies      : chr  "Clear " "Cloudy" "Cloudy" "Cloudy" ...
##  $ day_night  : chr  "Day" "Night" "Night" "Night" ...
##  $ cap        : chr  "NO" "NO" "NO" "NO" ...
##  $ shirt      : chr  "NO" "NO" "NO" "NO" ...
##  $ fireworks  : chr  "NO" "NO" "NO" "YES" ...
##  $ bobblehead : chr  "NO" "NO" "NO" "NO" ...
It looks like our data has twelve different variables, with the last four cap, shirt, fireworks, and bobblehead as promotions at those home games.
Variables
Now let’s create a few variables from this data set:
# First let's get a look at the names of our different columns of data that will become the variables:

for (i in 1:length(baseball)) {
column <- (names(baseball[i]))
print(column)
}
## [1] "month"
## [1] "day"
## [1] "attend"
## [1] "day_of_week"
## [1] "opponent"
## [1] "temp"
## [1] "skies"
## [1] "day_night"
## [1] "cap"
## [1] "shirt"
## [1] "fireworks"
## [1] "bobblehead"
Freebies!
Everybody loves free stuff. Let’s create variables for the promotional items, showing only the data for days when there was a promotional event:
promoCap <- subset(baseball, baseball$cap == "YES")
promoShirt <- subset(baseball, baseball$shirt == "YES")
promoFireworks <- subset(baseball, baseball$fireworks == "YES")
promoBobblehead <- subset(baseball, baseball$bobblehead == "YES")
Now let’s get a look at the output of the promotional variables:
promoCap
##    month day attend day_of_week opponent temp  skies day_night cap shirt
## 42   JUL   3  33884     Tuesday     Reds   70 Cloudy     Night YES    NO
## 55   AUG   5  42495      Sunday     Cubs   83 Clear        Day YES    NO
##    fireworks bobblehead
## 42        NO         NO
## 55        NO         NO

promoShirt
##    month day attend day_of_week  opponent temp  skies day_night cap shirt
## 12   APR  29  48753      Sunday Nationals   74 Clear        Day  NO   YES
## 31   JUN  11  50559      Monday    Angels   68 Clear      Night  NO   YES
## 70   SEP   4  40619     Tuesday    Padres   78 Clear      Night  NO   YES
##    fireworks bobblehead
## 12        NO         NO
## 31        NO         NO
## 70        NO         NO

promoFireworks
##    month day attend day_of_week  opponent temp  skies day_night cap shirt
## 4    APR  13  31601      Friday    Padres   54 Cloudy     Night  NO    NO
## 10   APR  27  44807      Friday Nationals   66 Clear      Night  NO    NO
## 16   MAY  11  35591      Friday   Rockies   65 Clear      Night  NO    NO
## 21   MAY  18  40906      Friday Cardinals   64 Clear      Night  NO    NO
## 24   MAY  25  36283      Friday    Astros   59 Cloudy     Night  NO    NO
## 34   JUN  15  40432      Friday White Sox   67 Clear      Night  NO    NO
## 38   JUN  29  49763      Friday      Mets   72 Clear      Night  NO    NO
## 43   JUL   4  53570   Wednesday      Reds   70 Clear      Night  NO    NO
## 44   JUL  13  43873      Friday    Padres   76 Cloudy     Night  NO    NO
## 53   AUG   3  43537      Friday      Cubs   73 Clear      Night  NO    NO
## 62   AUG  24  39805      Friday   Marlins   71 Clear      Night  NO    NO
## 66   AUG  31  37622      Friday    Snakes   77 Clear      Night  NO    NO
## 73   SEP  14  40167      Friday Cardinals   85 Clear      Night  NO    NO
## 76   SEP  28  37133      Friday   Rockies   77 Clear      Night  NO    NO
##    fireworks bobblehead
## 4        YES         NO
## 10       YES         NO
## 16       YES         NO
## 21       YES         NO
## 24       YES         NO
## 34       YES         NO
## 38       YES         NO
## 43       YES         NO
## 44       YES         NO
## 53       YES         NO
## 62       YES         NO
## 66       YES         NO
## 73       YES         NO
## 76       YES         NO

promoBobblehead
##    month day attend day_of_week  opponent temp  skies day_night cap shirt
## 11   APR  28  54242    Saturday Nationals   71 Clear      Night  NO    NO
## 20   MAY  15  47077     Tuesday    Snakes   70 Clear      Night  NO    NO
## 28   MAY  29  51137     Tuesday   Brewers   74 Clear      Night  NO    NO
## 32   JUN  12  55279     Tuesday    Angels   66 Cloudy     Night  NO    NO
## 37   JUN  28  49006    Thursday      Mets   75 Clear      Night  NO    NO
## 40   JUL   1  55359      Sunday      Mets   75 Clear      Night  NO    NO
## 45   JUL  14  54014    Saturday    Padres   75 Clear      Night  NO    NO
## 51   JUL  31  52832     Tuesday    Snakes   75 Cloudy     Night  NO    NO
## 57   AUG   7  55024     Tuesday   Rockies   80 Clear      Night  NO    NO
## 60   AUG  21  56000     Tuesday    Giants   75 Clear      Night  NO    NO
## 65   AUG  30  54621    Thursday    Snakes   80 Clear      Night  NO    NO
##    fireworks bobblehead
## 11        NO        YES
## 20        NO        YES
## 28        NO        YES
## 32        NO        YES
## 37        NO        YES
## 40        NO        YES
## 45        NO        YES
## 51        NO        YES
## 57        NO        YES
## 60        NO        YES
## 65        NO        YES
Now let’s get a look at the summary of the promotional variables:
summary(promoCap)
##     month                day          attend      day_of_week
##  Length:2           Min.   :3.0   Min.   :33884   Length:2
##  Class :character   1st Qu.:3.5   1st Qu.:36037   Class :character
##  Mode  :character   Median :4.0   Median :38190   Mode  :character
##                     Mean   :4.0   Mean   :38190
##                     3rd Qu.:4.5   3rd Qu.:40342
##                     Max.   :5.0   Max.   :42495
##    opponent              temp          skies            day_night
##  Length:2           Min.   :70.00   Length:2           Length:2
##  Class :character   1st Qu.:73.25   Class :character   Class :character
##  Mode  :character   Median :76.50   Mode  :character   Mode  :character
##                     Mean   :76.50
##                     3rd Qu.:79.75
##                     Max.   :83.00
##      cap               shirt            fireworks          bobblehead
##  Length:2           Length:2           Length:2           Length:2
##  Class :character   Class :character   Class :character   Class :character
##  Mode  :character   Mode  :character   Mode  :character   Mode  :character
##
##
##

summary(promoShirt)
##     month                day            attend      day_of_week
##  Length:3           Min.   : 4.00   Min.   :40619   Length:3
##  Class :character   1st Qu.: 7.50   1st Qu.:44686   Class :character
##  Mode  :character   Median :11.00   Median :48753   Mode  :character
##                     Mean   :14.67   Mean   :46644
##                     3rd Qu.:20.00   3rd Qu.:49656
##                     Max.   :29.00   Max.   :50559
##    opponent              temp          skies            day_night
##  Length:3           Min.   :68.00   Length:3           Length:3
##  Class :character   1st Qu.:71.00   Class :character   Class :character
##  Mode  :character   Median :74.00   Mode  :character   Mode  :character
##                     Mean   :73.33
##                     3rd Qu.:76.00
##                     Max.   :78.00
##      cap               shirt            fireworks          bobblehead
##  Length:3           Length:3           Length:3           Length:3
##  Class :character   Class :character   Class :character   Class :character
##  Mode  :character   Mode  :character   Mode  :character   Mode  :character
##
##
##

summary(promoFireworks)
##     month                day            attend      day_of_week
##  Length:14          Min.   : 3.00   Min.   :31601   Length:14
##  Class :character   1st Qu.:13.00   1st Qu.:37255   Class :character
##  Mode  :character   Median :16.50   Median :40300   Mode  :character
##                     Mean   :18.21   Mean   :41078
##                     3rd Qu.:26.50   3rd Qu.:43789
##                     Max.   :31.00   Max.   :53570
##    opponent              temp          skies            day_night
##  Length:14          Min.   :54.00   Length:14          Length:14
##  Class :character   1st Qu.:65.25   Class :character   Class :character
##  Mode  :character   Median :70.50   Mode  :character   Mode  :character
##                     Mean   :69.71
##                     3rd Qu.:75.25
##                     Max.   :85.00
##      cap               shirt            fireworks          bobblehead
##  Length:14          Length:14          Length:14          Length:14
##  Class :character   Class :character   Class :character   Class :character
##  Mode  :character   Mode  :character   Mode  :character   Mode  :character
##
##
##

summary(promoBobblehead)
##     month                day            attend      day_of_week
##  Length:11          Min.   : 1.00   Min.   :47077   Length:11
##  Class :character   1st Qu.:13.00   1st Qu.:51984   Class :character
##  Mode  :character   Median :21.00   Median :54242   Mode  :character
##                     Mean   :19.64   Mean   :53145
##                     3rd Qu.:28.50   3rd Qu.:55152
##                     Max.   :31.00   Max.   :56000
##    opponent              temp          skies            day_night
##  Length:11          Min.   :66.00   Length:11          Length:11
##  Class :character   1st Qu.:72.50   Class :character   Class :character
##  Mode  :character   Median :75.00   Mode  :character   Mode  :character
##                     Mean   :74.18
##                     3rd Qu.:75.00
##                     Max.   :80.00
##      cap               shirt            fireworks          bobblehead
##  Length:11          Length:11          Length:11          Length:11
##  Class :character   Class :character   Class :character   Class :character
##  Mode  :character   Mode  :character   Mode  :character   Mode  :character
Exploration of Promotions
Looking at the promotions, we see that of the four different types of promotions the Dodgers ran during home games this season, they broke down as follows:
| Promotion Type | Promotion Frequency | Mean Attendance |
|---|---|---|
| Cap | 2 | 38,190 |
| Shirt | 3 | 46,644 |
| Fireworks | 14 | 41,078 |
| Bobblehead | 11 | 53,145 |
As a little synopsis of that information, it’s probably fair to say that fireworks at the conclusion of a game are pretty common. Lots of teams do this, and they probably aren’t a huge driver in the decision to take in a baseball game. The mean for attendance on games when fireworks for a promotion was 41,078. Not too shabby.
The cap and shirt promotions were pretty few and far between, with only five games offering a fan either of those giveaways. The mean attendance on cap giveaway games was 38,190 and on shirt giveaways it was 46,644.
But look at the bobbleheads. There were a total of eleven games when the Dodgers gave away a bobblehead, and the mean attendance during these games was 53,145. Dude. People love free stuff, and a bobblehead is just a really cool, quirky, and fun thing to have on your desk at work or home, eh?
Box Plots
Now let’s create a few box plots to get a look at our data. We’ll start with one that looks at attendance on the days of the week:
# Boxplot of day of the week attendance:

boxplot(attend~day_of_week,data=baseball, main="Day of the Week Attendance",
   xlab="Day", ylab="Attendance")
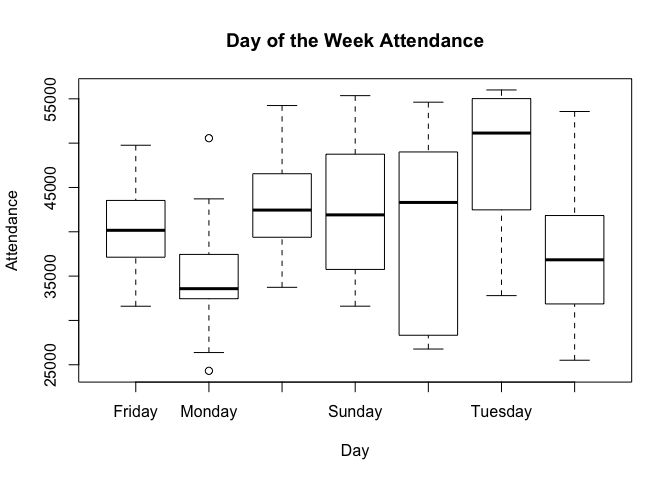
That’s a bit messy so let’s order the days like a regular weekly calendar rather than using the default alphabetical order. Let’s also give the boxplot’s color something more applicable to our example, the use of dodgerblue:1
baseball$day_of_week <- factor(baseball$day_of_week , levels=c("Sunday", "Monday", "Tuesday", "Wednesday", "Thursday", "Friday", "Saturday"))

# Boxplot of day of the week attendance:

boxplot(attend~day_of_week,data=baseball, main="Day of the Week Attendance",
   xlab="Day", ylab="Attendance", las=2, col="dodgerblue")
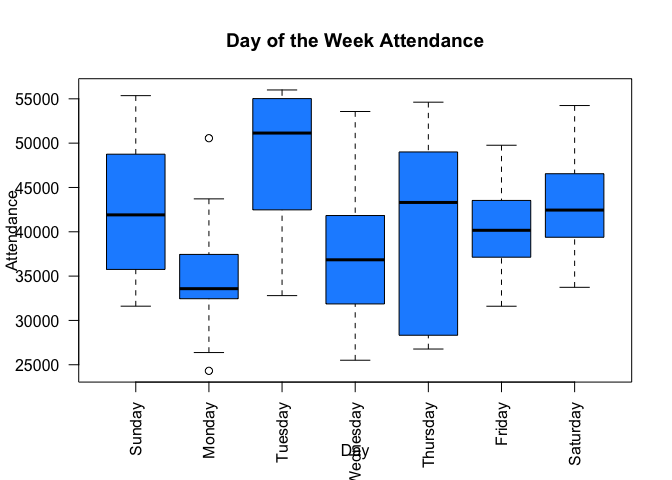
A few things stand out here. It looks like Mondays and Wednesdays are the days of the week where fans aren’t coming out for baseball. That makes sense because most people are either working or in school during the day, and at night might not come out due to getting an early start the next day for work or school.
Higher attendance on a Friday, Saturday, or Sunday makes sense.
Terrific Tuesday
What’s up with Tuesdays? Pulling in an average of 50,000 people on a Tuesday seems rather remarkable. Let’s keep pulling this thread. Let’s go in for a deeper dive on trying to see what drove that Tuesday attendance.
tuesday <- subset(baseball, baseball$day_of_week == "Tuesday")
print(tuesday)
##    month day attend day_of_week opponent temp  skies day_night cap shirt
## 1    APR  10  56000     Tuesday  Pirates   67 Clear        Day  NO    NO
## 8    APR  24  44014     Tuesday   Braves   63 Cloudy     Night  NO    NO
## 14   MAY   8  32799     Tuesday   Giants   75 Clear      Night  NO    NO
## 20   MAY  15  47077     Tuesday   Snakes   70 Clear      Night  NO    NO
## 28   MAY  29  51137     Tuesday  Brewers   74 Clear      Night  NO    NO
## 32   JUN  12  55279     Tuesday   Angels   66 Cloudy     Night  NO    NO
## 42   JUL   3  33884     Tuesday     Reds   70 Cloudy     Night YES    NO
## 48   JUL  17  53498     Tuesday Phillies   70 Clear      Night  NO    NO
## 51   JUL  31  52832     Tuesday   Snakes   75 Cloudy     Night  NO    NO
## 57   AUG   7  55024     Tuesday  Rockies   80 Clear      Night  NO    NO
## 60   AUG  21  56000     Tuesday   Giants   75 Clear      Night  NO    NO
## 70   SEP   4  40619     Tuesday   Padres   78 Clear      Night  NO   YES
## 80   OCT   2  42473     Tuesday   Giants   83 Clear      Night  NO    NO
##    fireworks bobblehead
## 1         NO         NO
## 8         NO         NO
## 14        NO         NO
## 20        NO        YES
## 28        NO        YES
## 32        NO        YES
## 42        NO         NO
## 48        NO         NO
## 51        NO        YES
## 57        NO        YES
## 60        NO        YES
## 70        NO         NO
## 80        NO         NO
summary(tuesday)
##     month                day            attend         day_of_week
##  Length:13          Min.   : 2.00   Min.   :32799   Sunday   : 0
##  Class :character   1st Qu.: 7.00   1st Qu.:42473   Monday   : 0
##  Mode  :character   Median :12.00   Median :51137   Tuesday  :13
##                     Mean   :14.08   Mean   :47741   Wednesday: 0
##                     3rd Qu.:21.00   3rd Qu.:55024   Thursday : 0
##                     Max.   :31.00   Max.   :56000   Friday   : 0
##                                                     Saturday : 0
##    opponent              temp          skies            day_night
##  Length:13          Min.   :63.00   Length:13          Length:13
##  Class :character   1st Qu.:70.00   Class :character   Class :character
##  Mode  :character   Median :74.00   Mode  :character   Mode  :character
##                     Mean   :72.77
##                     3rd Qu.:75.00
##                     Max.   :83.00
##
##      cap               shirt            fireworks          bobblehead
##  Length:13          Length:13          Length:13          Length:13
##  Class :character   Class :character   Class :character   Class :character
##  Mode  :character   Mode  :character   Mode  :character   Mode  :character
Looking things over here, it seems the Dodgers are heavily using promotional giveaways on Tuesday to bring fans out. In fact, of the 13 home games on Tuesdays in their 2012 season, the Dodgers gave fans a free cap (1 time), shirt (1 time), and bobbleheads (6 times) just for showing up (and I’m assuming that the promo items are limited to the first x amount of fans to arrive as this encourages people to get there early/on time to receive the promotional item).
Just like in our Exploration of Promotions area earlier, we see that promotions are important for briging out crowds, and fans especially are fans of bobbleheads.
Monday, Monday
Now let’s isolate Mondays and see if we can tell why the draw on that day is so low:
monday <- subset(baseball, baseball$day_of_week == "Monday")
print(monday)
##    month day attend day_of_week opponent temp  skies day_night cap shirt
## 7    APR  23  26376      Monday   Braves   60 Cloudy     Night  NO    NO
## 13   MAY   7  43713      Monday   Giants   67 Clear      Night  NO    NO
## 19   MAY  14  24312      Monday   Snakes   67 Clear      Night  NO    NO
## 27   MAY  28  38016      Monday  Brewers   73 Clear      Night  NO    NO
## 31   JUN  11  50559      Monday   Angels   68 Clear      Night  NO   YES
## 41   JUL   2  34493      Monday     Reds   70 Clear      Night  NO    NO
## 47   JUL  16  32238      Monday Phillies   67 Clear      Night  NO    NO
## 50   JUL  30  33180      Monday   Snakes   73 Clear      Night  NO    NO
## 56   AUG   6  32659      Monday  Rockies   79 Clear      Night  NO    NO
## 59   AUG  20  36878      Monday   Giants   80 Clear      Night  NO    NO
## 69   SEP   3  33540      Monday   Padres   84 Cloudy     Night  NO    NO
## 79   OCT   1  33624      Monday   Giants   86 Clear      Night  NO    NO
##    fireworks bobblehead
## 7         NO         NO
## 13        NO         NO
## 19        NO         NO
## 27        NO         NO
## 31        NO         NO
## 41        NO         NO
## 47        NO         NO
## 50        NO         NO
## 56        NO         NO
## 59        NO         NO
## 69        NO         NO
## 79        NO         NO
summary(monday)
##     month                day            attend         day_of_week
##  Length:12          Min.   : 1.00   Min.   :24312   Sunday   : 0
##  Class :character   1st Qu.: 5.25   1st Qu.:32554   Monday   :12
##  Mode  :character   Median :12.50   Median :33582   Tuesday  : 0
##                     Mean   :13.42   Mean   :34966   Wednesday: 0
##                     3rd Qu.:20.75   3rd Qu.:37162   Thursday : 0
##                     Max.   :30.00   Max.   :50559   Friday   : 0
##                                                     Saturday : 0
##    opponent              temp          skies            day_night
##  Length:12          Min.   :60.00   Length:12          Length:12
##  Class :character   1st Qu.:67.00   Class :character   Class :character
##  Mode  :character   Median :71.50   Mode  :character   Mode  :character
##                     Mean   :72.83
##                     3rd Qu.:79.25
##                     Max.   :86.00
##
##      cap               shirt            fireworks          bobblehead
##  Length:12          Length:12          Length:12          Length:12
##  Class :character   Class :character   Class :character   Class :character
##  Mode  :character   Mode  :character   Mode  :character   Mode  :character
With a mean attendance of 34,966, Mondays were the lowest attendance draw at Dodger Stadium in 2012. One thing really stand out to me as a good reason why, that being how many promotions were done on Mondays: of the 12 home games on Mondays in 2012, the Dodgers only had 1 promotional giveaway, a shirt on June 11th against the Angels. The other thing that stands out? The night they gave away that shirt to their fans they had the largest Monday night crowd of the season bringing in 50,559 people. Swag fills the seats!
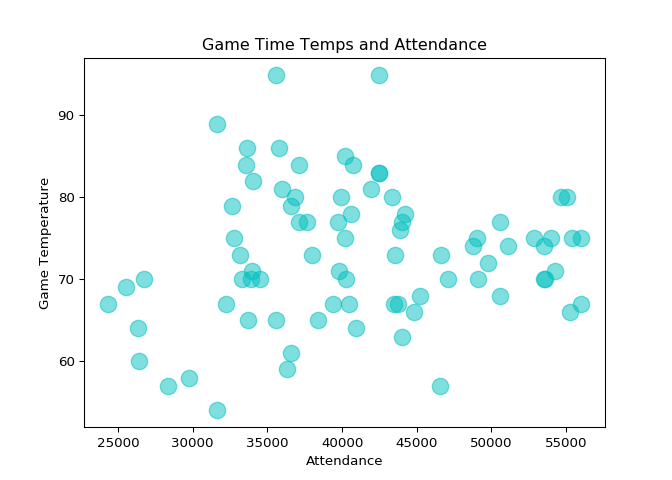
Scatter Plots
Now let’s create a few scatter plots to get a look at our data. We’ll start with one that looks at attendance and the game time temperature to see if there’s any correlation there:
# Scatter plot of attendance and weather:
import pandas as pd
import numpy as np
import matplotlib.pyplot as plt

baseball = pd.read_csv (r'dodgers.csv')

x = baseball.attend
y = baseball.temp

plt.scatter(x, y, c='c', alpha=0.5, s=150.00)
plt.title("Game Time Temps and Attendance")
plt.xlabel("Attendance")
plt.ylabel("Game Temperature")
plt.show()
Linear Regression Model
I’d like to do linear regression analysis using game attendance and game time temperature to see if there is any impact.
# Run our linear regression model:

simple.fit = lm(attend~temp, data=baseball)
summary(simple.fit)
##
## Call:
## lm(formula = attend ~ temp, data = baseball)
##
## Residuals:
##    Min     1Q Median     3Q    Max
## -16121  -6555  -1023   6348  15567
##
## Coefficients:
##             Estimate Std. Error t value Pr(>|t|)
## (Intercept) 33819.22    8221.94   4.113 9.49e-05 ***
## temp           98.72     111.69   0.884    0.379
## ---
## Signif. codes:  0 '***' 0.001 '**' 0.01 '*' 0.05 '.' 0.1 ' ' 1
##
## Residual standard error: 8309 on 79 degrees of freedom
## Multiple R-squared:  0.009791,   Adjusted R-squared:  -0.002743
## F-statistic: 0.7812 on 1 and 79 DF,  p-value: 0.3795
A cursory glance at the regression output:
- Residuals: The section summarizes the residuals, the error between the prediction of the model and the actual results. Smaller residuals are better.
- Coefficients: For each variable and the intercept, a weight is produced and that weight has other attributes like the standard error, a t-test value and significance.
- Residual Standard Error: This is the standard deviation of the residuals. Smaller is better.
Based upon a quick look at things here, the game time temperature doesn’t really show that it impacts people coming out for games at Dodger Stadium.
Train/Test and Regression Testing
Let’s do some train/test splits on our data, again I will isolate weather:
import pandas as pd
from sklearn import linear_model
from sklearn.model_selection import train_test_split
from matplotlib import pyplot as pltd

# Import the baseball file into a data frame:
baseballP = pd.read_csv (r'dodgers.csv')
print(baseballP)

##    month  day  attend day_of_week  ... cap  shirt fireworks bobblehead
## 0    APR   10   56000     Tuesday  ...  NO     NO        NO         NO
## 1    APR   11   29729   Wednesday  ...  NO     NO        NO         NO
## 2    APR   12   28328    Thursday  ...  NO     NO        NO         NO
## 3    APR   13   31601      Friday  ...  NO     NO       YES         NO
## 4    APR   14   46549    Saturday  ...  NO     NO        NO         NO
## ..   ...  ...     ...         ...  ...  ..    ...       ...        ...
## 76   SEP   29   40724    Saturday  ...  NO     NO        NO         NO
## 77   SEP   30   35607      Sunday  ...  NO     NO        NO         NO
## 78   OCT    1   33624      Monday  ...  NO     NO        NO         NO
## 79   OCT    2   42473     Tuesday  ...  NO     NO        NO         NO
## 80   OCT    3   34014   Wednesday  ...  NO     NO        NO         NO
##
## [81 rows x 12 columns]
columns = "temp".split()
print(columns)
## ['temp']
df = pd.DataFrame(baseballP, columns=columns)
print(df)

# define the attendand variable 'attend' (dependent variable) as y:
##     temp
## 0     67
## 1     58
## 2     57
## 3     54
## 4     57
## ..   ...
## 76    84
## 77    95
## 78    86
## 79    83
## 80    82
##
## [81 rows x 1 columns]
y = baseballP.attend

# Now we can use the train_test_split function in order to make the split. The test_size=0.2 inside the function indicates the percentage of the data that should be held over for testing. It’s usually around 80/20 or 70/30:

# Create the training and testing vars
X_train, X_test, y_train, y_test = train_test_split(df, y, test_size=0.2)
print(X_train.shape, y_train.shape)
## (64, 1) (64,)
print(X_test.shape, y_test.shape)
## (17, 1) (17,)
Now we’ll fit the model on the training data:
# fit a model
lm = linear_model.LinearRegression()
model = lm.fit(X_train, y_train)
predictions = lm.predict(X_test)
print(predictions)
## [42572.38727899 43091.38714324 42157.18738758 41845.78746903
##  41949.58744188 42053.38741473 41119.18765908 40288.78787627
##  44025.58689889 41119.18765908 40807.78774053 42572.38727899
##  40911.58771338 41845.78746903 42883.78719754 41119.18765908
##  41430.58757763]
Now let’s plot that training model:
## The line / model
plt.scatter(y_test, predictions)
plt.xlabel("True Values")
plt.ylabel("Predictions")
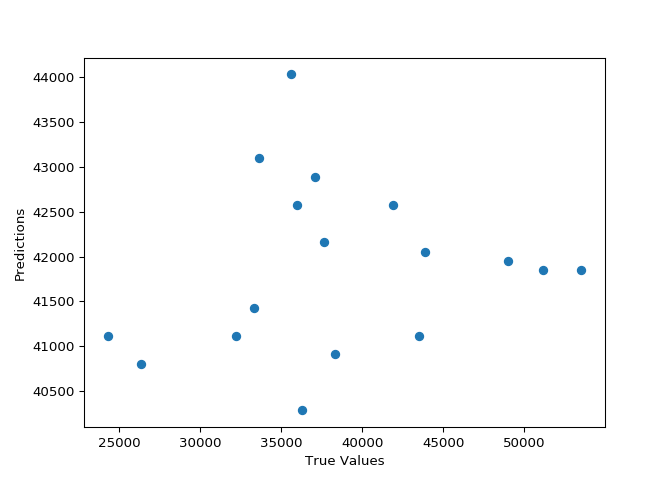
And our accuracy score:
print("Score:", model.score(X_test, y_test))
## Score: -0.17279789036241633
All of the training/test split info also yields points to temperature data not having a big impact on crowd size.
Final Recommendation
After going through the data in different ways, including scatter plots, box plots, and regression analysis, my main recommendation is for the Dodgers marketing department to plan to offer more giveaway items, in particular, bobbleheads. Of the 11 times the Dodgers had a bobblehead giveaway, they put large numbers in the stadium. Looking through the data, they had a large turnout on Tuesdays, primarily due to bobblehead giveaways.
To answer the original problem — “What night would be the best to run a marketing promotion to increase attendance?” — my recommendation is to start offering bobbleheads on Mondays to help bring more people out. Mondays were the lowest draw during the week, so giving the fans a reason to show up by giving them a freebie would be a good way to get attendance boosted on that day.
-
Ugh, as a Cubs fan, this hurts, but I’ll stay professional for the sake of this assignment. ↩